IR Playbook
How to leverage data to successfully navigate market expectations
This year has witnessed a dramatic uptick in market volatility, driven by US trade policies and responsive action taken by other countries. With the picture changing on a near daily basis, companies have struggled to provide guidance, and the financial analysts who follow them have needed to regularly search for data elsewhere and rewrite their forecasts.
For IR teams, this means that the power to make decisions – and to drive strategic thinking within their organizations – is at risk. We all know that IROs already play a crucial role at the nexus between their company and the market. They help key stakeholders interpret the latest policy moves, correct erroneous information and channel intelligence about shifting expectations back to the company, informing strategic discussions and communication plans.
But, to do so effectively, IR teams must have access to real-time, accurate and trustworthy data about market perspectives. Being able to find not just more data, but higher-quality data, helps IR professionals make more informed decisions and assumptions. This, in turn, allows them to be better allies for their senior management, investors and covering sell-side analysts.
On the flipside, misleading or out-of-date information can have the reverse effect. It can prevent companies from operating with a clear line of sight, harm stakeholder relationships and damage the credibility of the IR function within an organization.
Another crucial factor is the growing role of AI technology. With data sources proliferating, IR teams are increasingly turning to AI-powered platforms to parse large quantities of information and deliver insights more quicky. However, no matter how powerful the tool, the output is only as good as the data quality you rely on. With management and boards expecting IROs to make the most of the AI opportunity, IR is under pressure to identify data and data platforms that provide unique and trustworthy insights.
All this comes amid a changing relationship between IR teams and their following analysts. There has been regulatory change – Mifid II in Europe for example. Headcounts on the sell side have also fallen, with analysts taking on more coverage as others leave the broking world for IR. These shifts are increasing the importance of the IR role in the analyst-corporate relationship.
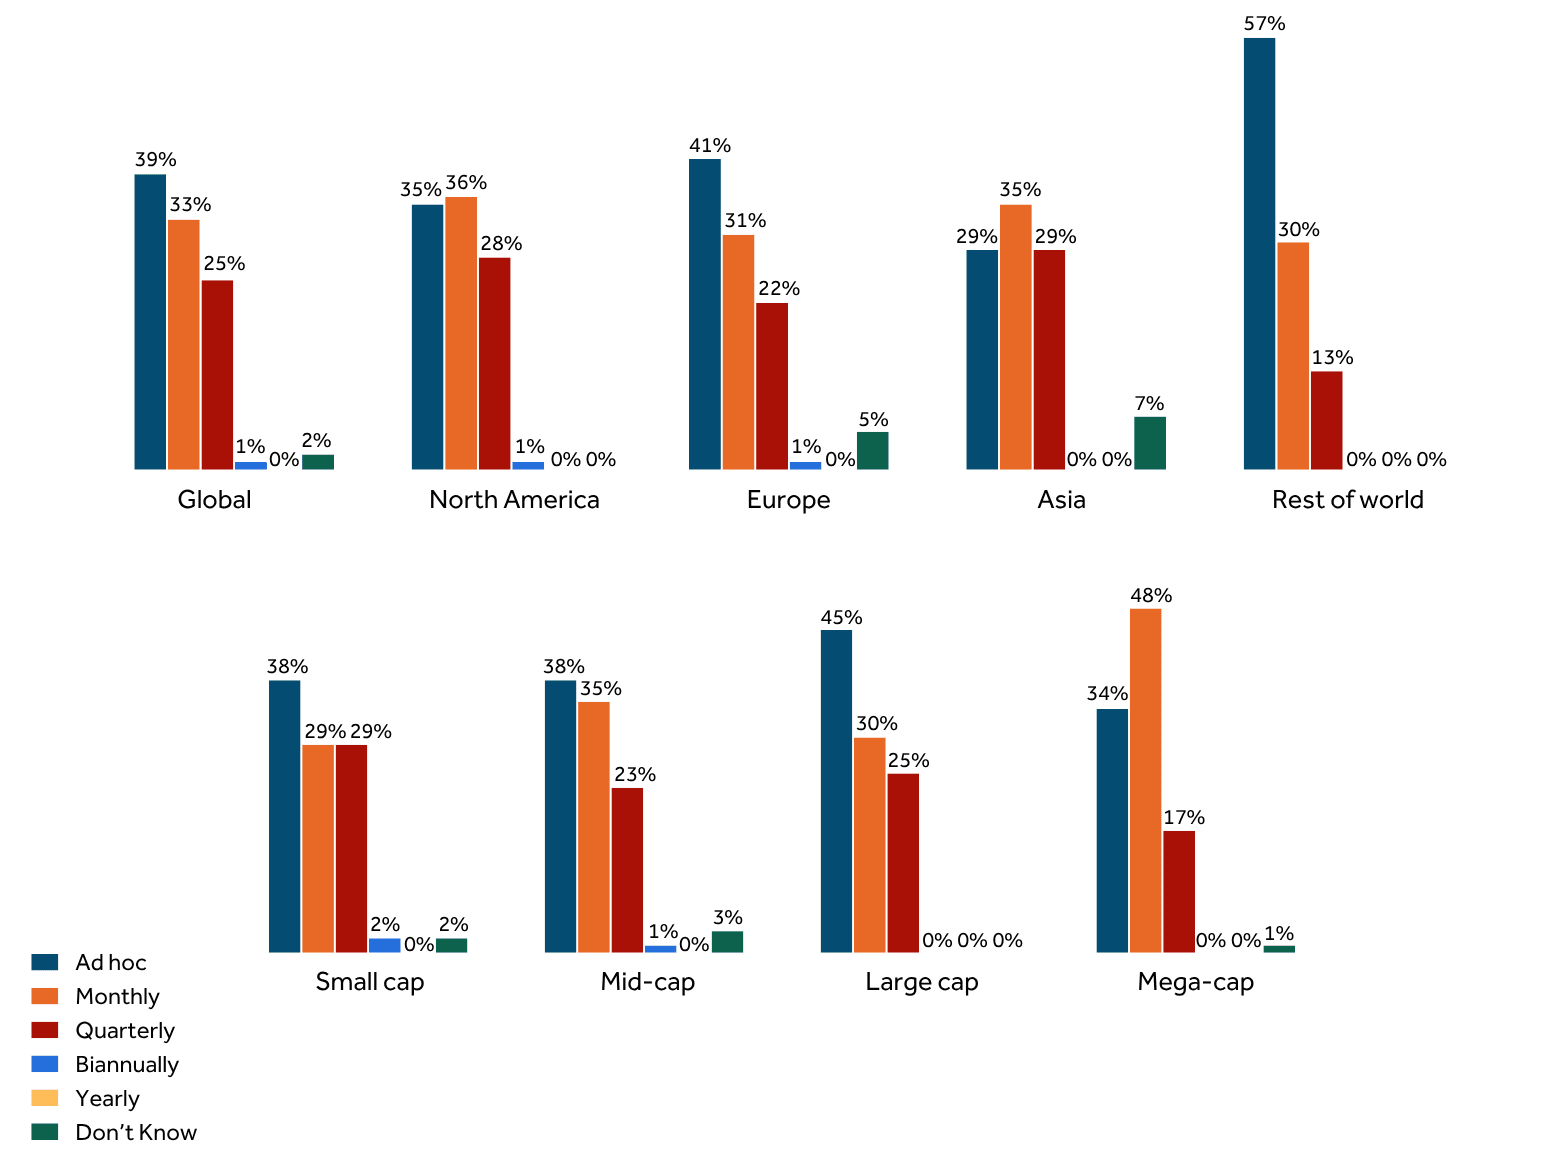
IR Impact research highlights the differing approaches to IR-sell side interaction at listed companies. On average, most respondents interact with the sell side on an ad hoc basis (39 percent) while a third (33 percent) do so monthly and 25 percent do so quarterly.
Respondents in Asia are slightly more likely to keep their interactions quarterly, while those in Europe and the rest of the world are more likely to be in touch as and when. Almost half of mega-cap firms (48 percent) have a monthly interaction cadence, indicating that their investor relations activities are often more regimented than those of smaller companies.
For those on the sell side, ad hoc typically works as well, though most point to a certain level of structure in their corporate engagements – particularly those covering companies in jurisdictions where reporting is quarterly.
In this IR Impact Playbook, written in partnership with Visible Alpha, part of S&P Global, you will hear how IR teams are turning market intelligence into actionable strategy to help their companies navigate financial volatility. It includes workflows tackling some of the most common IR activities, illustrating how a full grasp of market data can help reduce friction and ensure good results.
When seeking to understand market expectations, the first ports of call for IR teams are usually sell-side analyst reports and models, and the consensus figures put out by third-party data providers. While these sources offer an initial take on how your company is viewed, they don’t capture the depth of information contained in market forecasts.
Generally, when you look at estimates or consensus, it’s based on the research reports that the analysts put out, which are qualitative by nature. These don’t go too far into the weeds of the segmentation of the business, operating metrics or KPIs. They tend to just focus on areas like revenue, EBITDA and EPS.
There are data platforms, however, that have access to the raw working analyst models, offering a unique, in-depth view of what the analysts are actually predicting companies will do. These tools can automate the whole process for gathering raw working models, creating a consensus around that depth of information, and making that immediately and automatically available to IR teams.
Through Visible Alpha, IR teams can access a repository which contains the analyst models covering their business, so there is no need to go out and manually request them. These models are automatically reprocessed when an analyst makes an update and fed into a consensus view.
That consensus is not just top-line metrics. It covers full segmentation of a business, including full operating metrics, KPIs and anything else the Street is putting out. Furthermore, all the information is fully traceable. IROs can go to the cell level of each model per data point to see where everything came from. If they see an estimate, and it seems to be off in some way, it’s possible to go in and audit it back to see which analyst is shifting consensus.
A further aspect of the platform is the way the database is structured. Different business segments have been standardized to allow for easier comparison.
For example, Apple’s data contains iPhone units and iPhone revenues projected, while Samsung’s data has the same for Galaxy units and Galaxy revenues. That information can be normalized into smartphone units and revenues, allowing users to go cross-sectional and gain insight into peers that they probably didn’t have access to.
In this section, we’ll look at how some of these data sources can be utilized as part of common IR activities. To begin with, in-depth data on market expectations is vital to support IR teams as they prepare, execute and follow up during the earnings process.
When it comes to tracking earnings estimates during earnings, many IR teams follow a manual process. It’s common to maintain a large Excel spreadsheet, featuring different tabs for different analyst models, and a summary page tying everything together.
If it works perfectly, it can be helpful. But the problem is, it often doesn’t. It’s a very cumbersome process to get all the models together in the first place. After that, you have to keep updating the spreadsheet and investigating why errors occur.
Visible Alpha automates that process. The models are already sitting there in the system and processed into consensus figures, so there is no need to go out and request individual models or adapt them internally.
It’s also possible, using an Excel add-on, to take either an analyst’s financial model or your own, internal ones and add in Visible Alpha’s data and formulas, removing the manual work while retaining the same workflow and output as your company is used to.
Maintaining that flow means that – particularly around events such as earnings – IR teams can spend less time gathering and processing information, and more time analyzing it. Many IROs complain that they don’t have enough bandwidth to even look at certain metrics in their summary pages, especially during busy periods: with automation, you can reclaim that valuable time to truly stay on top of the details and more effectively communicate with key internal stakeholders.
This allows companies to understand with more insight and precision a variety of areas during earnings: for example, is the Street truly on or off where we are for guidance? Is anything changing significantly that we need to be aware of? Is there something our C-suite is going to want to know going into earnings about the data?
The depth of information is particularly useful when you want to check any trends related to specific business units or products. Without automation, IROs need to go into each model, understand the different naming conventions, and try to pull that information together at short notice.
By contrast, when the models are easily available and automatically processed, it’s far quicker to check what’s happening on a deep level across market expectations. Email alerts can also be set up, so any revisions to analyst models are instantly flagged in your inbox.
Staying on top of consensus is always front of mind during earnings. But tracking revisions over time, especially at depth within analyst models, is another important factor for staying on top of market sentiment.
Here, it’s important for data providers to capture all the revised models put out by analysts, incorporate them into consensus and then time stamp consensus daily. With that information, IR teams can start to see how estimates are changing across longer periods and if any broader trends are emerging that require attention.
For example, a company might think its revenue numbers are performing well, but if the Street has been bearish on that metric, and its projections are going down and down in a significant way, you can identify and flag that, especially if the forecasts are getting away from guidance.
This sort of data is not just more valuable but can help savvy IROs make strategic decisions and suggestions to their management teams, cementing even further their operational value to their organizations.
IR teams spend a lot of time understanding how they compare against peers, both against top-line metrics and across different business units. In this context, getting on top of market expectations is even harder, when you consider the complexity of different business structures and the variety of analyst views being generated.
For IR teams, data that tracks market views deep into the business and is standardized for fast comparison allows them to dive straight into analysis. With Visible Alpha the data about each company is normalized and tagged so you can compare different products or segments across your whole sector.
This allows IROs to rapidly complete two key tasks. One, you can put together a large-scale comp group of any companies you choose, and look at whatever specific element of their business operations you are interested in.
And two, you can use tags to look at different business segments regardless of the company’s broader sector profile. For example, Apple is a computer hardware company and Netflix is a video streaming provider, but both have streaming services. With the right data, you can easily compare just the streaming businesses of those two names.
This kind of data standardization is especially valuable for complex businesses that don’t easily fit into a peer group. As an IRO, you can break out the performance of different units against an appropriate set of competitors or competitor business lines.
Taking it a step further, companies can compare the trends in their own numbers with those of peers. If the Street is becoming more bearish about a particular metric, data can help you explain to the C-suite whether this is a broader shift across the industry, or whether your company is being singled out on this topic.
You can use consensus trends over time to then help prepare your next board presentation and demonstrate to them how market expectations are evolving not only against prior quarters, but relative to your peers.
Finally, Visible Alpha’s data offers the chance to efficiently review full forecasts for peer companies. This information is not typically available to IR departments, and they need to examine a lot of research reports to get even a sense of it. Visible Alpha puts users in front of the actual analyst level detail for competitors. While you wouldn’t see exactly what one specific broker is saying, you can access consensus for specific operating metrics.
Being able to track category-level sentiment shifts can easily feed into an IR team’s broader communication with the market, reflecting how an organization is positioned as trends evolve. For instance, if the market is cooling on video streaming overall – say Netflix and Disney are losing a large number of subscribers – then an IRO can coach their CEO to focus investor communications on enterprise deals or hardware bundling instead.
Moreover, IR teams regularly receive ad-hoc questions from their senior management team about market trends. During a conference or roadshow, it’s common for the CEO or CFO to come out of a meeting and start asking the IRO about, for example, a data point that keeps being mentioned.
In this situation, it’s a big job to manually search through multiple analyst reports, identify the area in question and then pull together any trends. But with the right data and tools, you can jump in and quickly pull out any trends about that specific metric, either related to your own company or the sector. Having that insight at your disposal enables you to be a stronger ally for your C-suite when they need you.
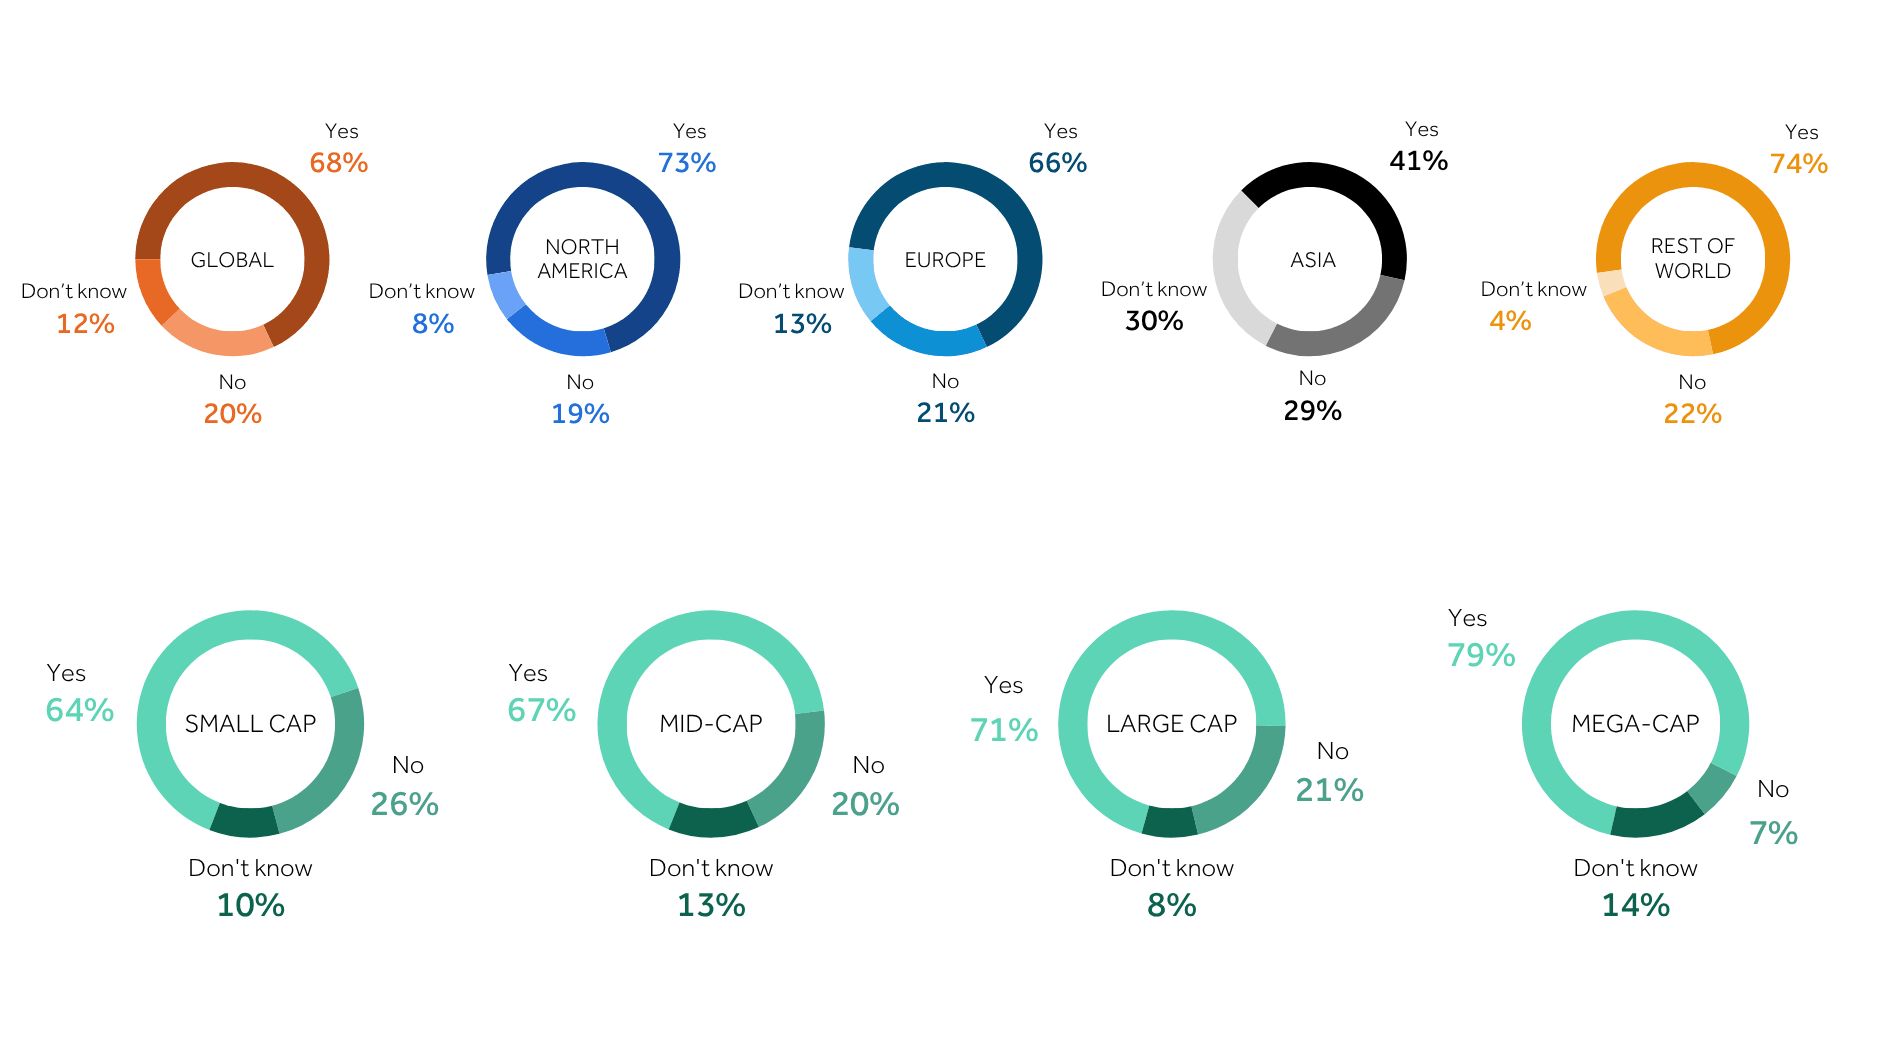
Overall, respondents to IR Impact’s survey choose to partner with sell-side firms even if those firms have a negative rating on their company, with 68 percent of respondents doing so globally. This tendency is particularly pronounced at North American companies (73 percent) and least supported by Asian firms, of which only 41 percent would do so.
The likelihood of a company working with a sell-side firm that rates it negatively increases with cap size, suggesting smaller companies feel a need to be more selective about the sell-side firms they work with.
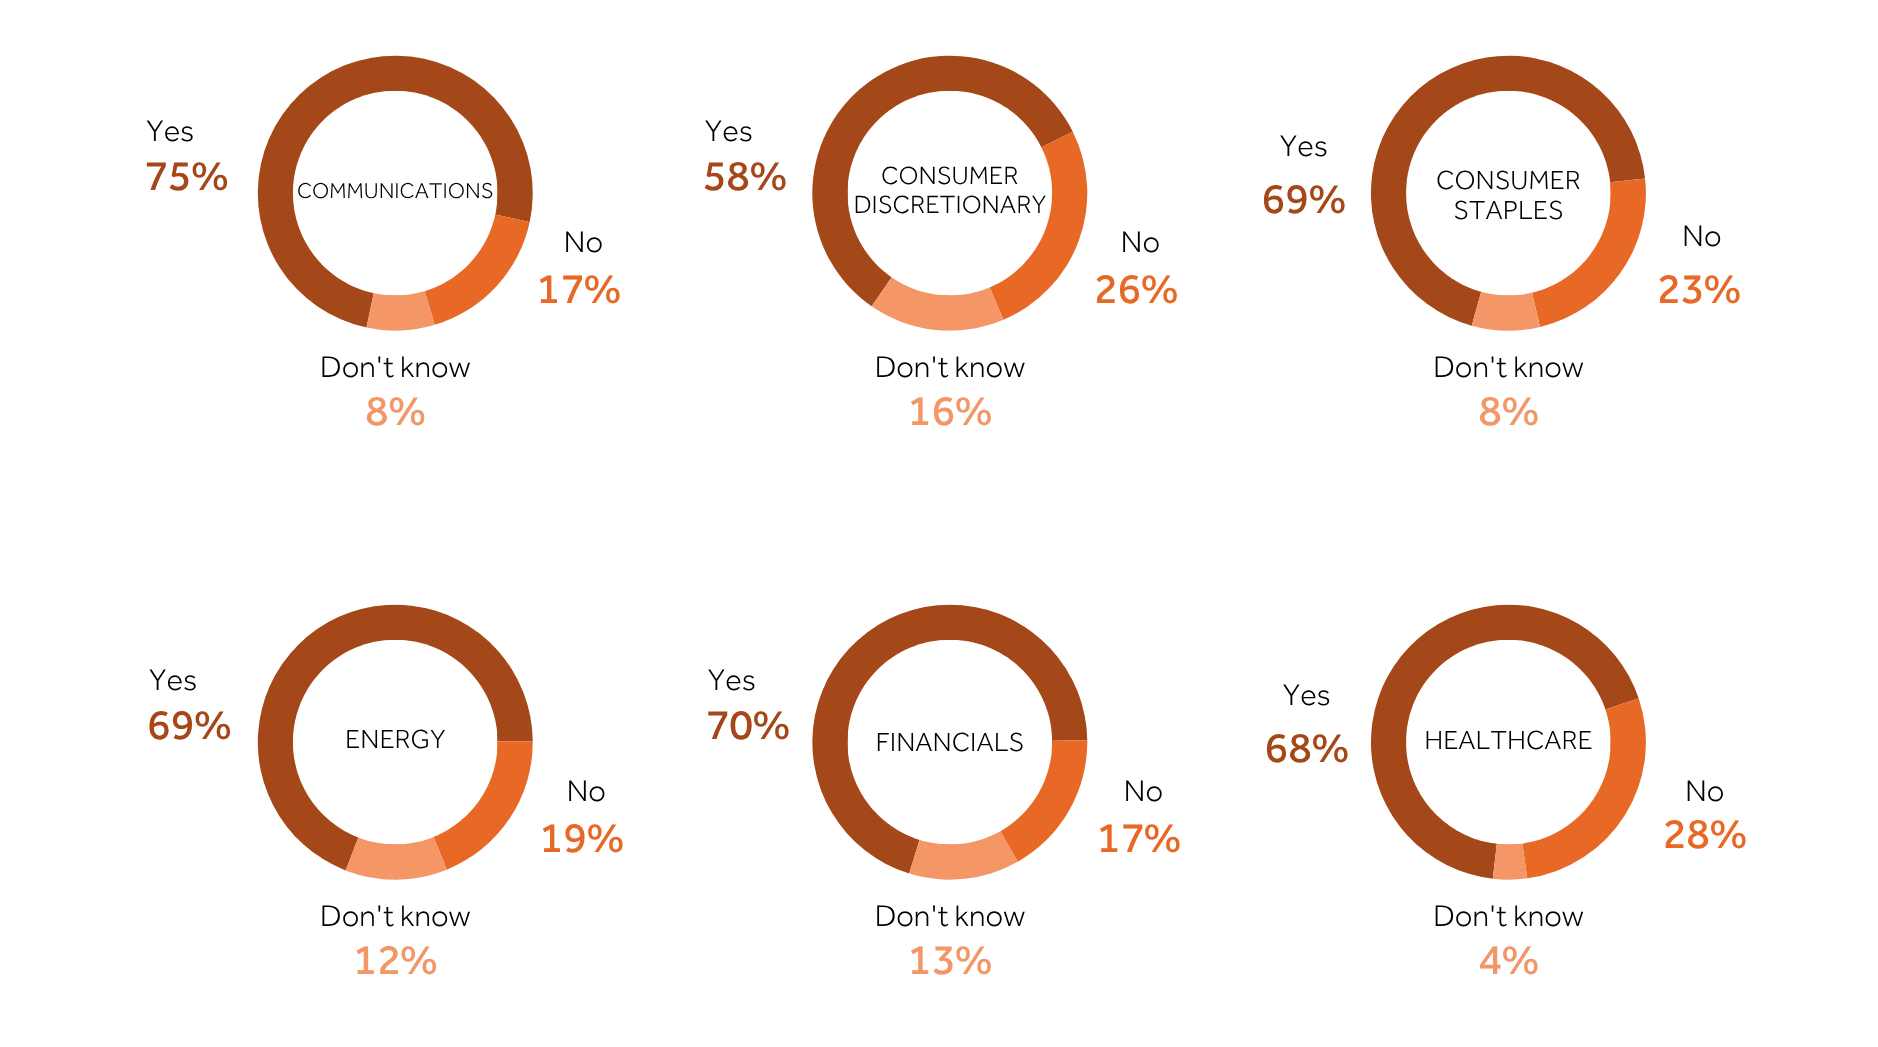
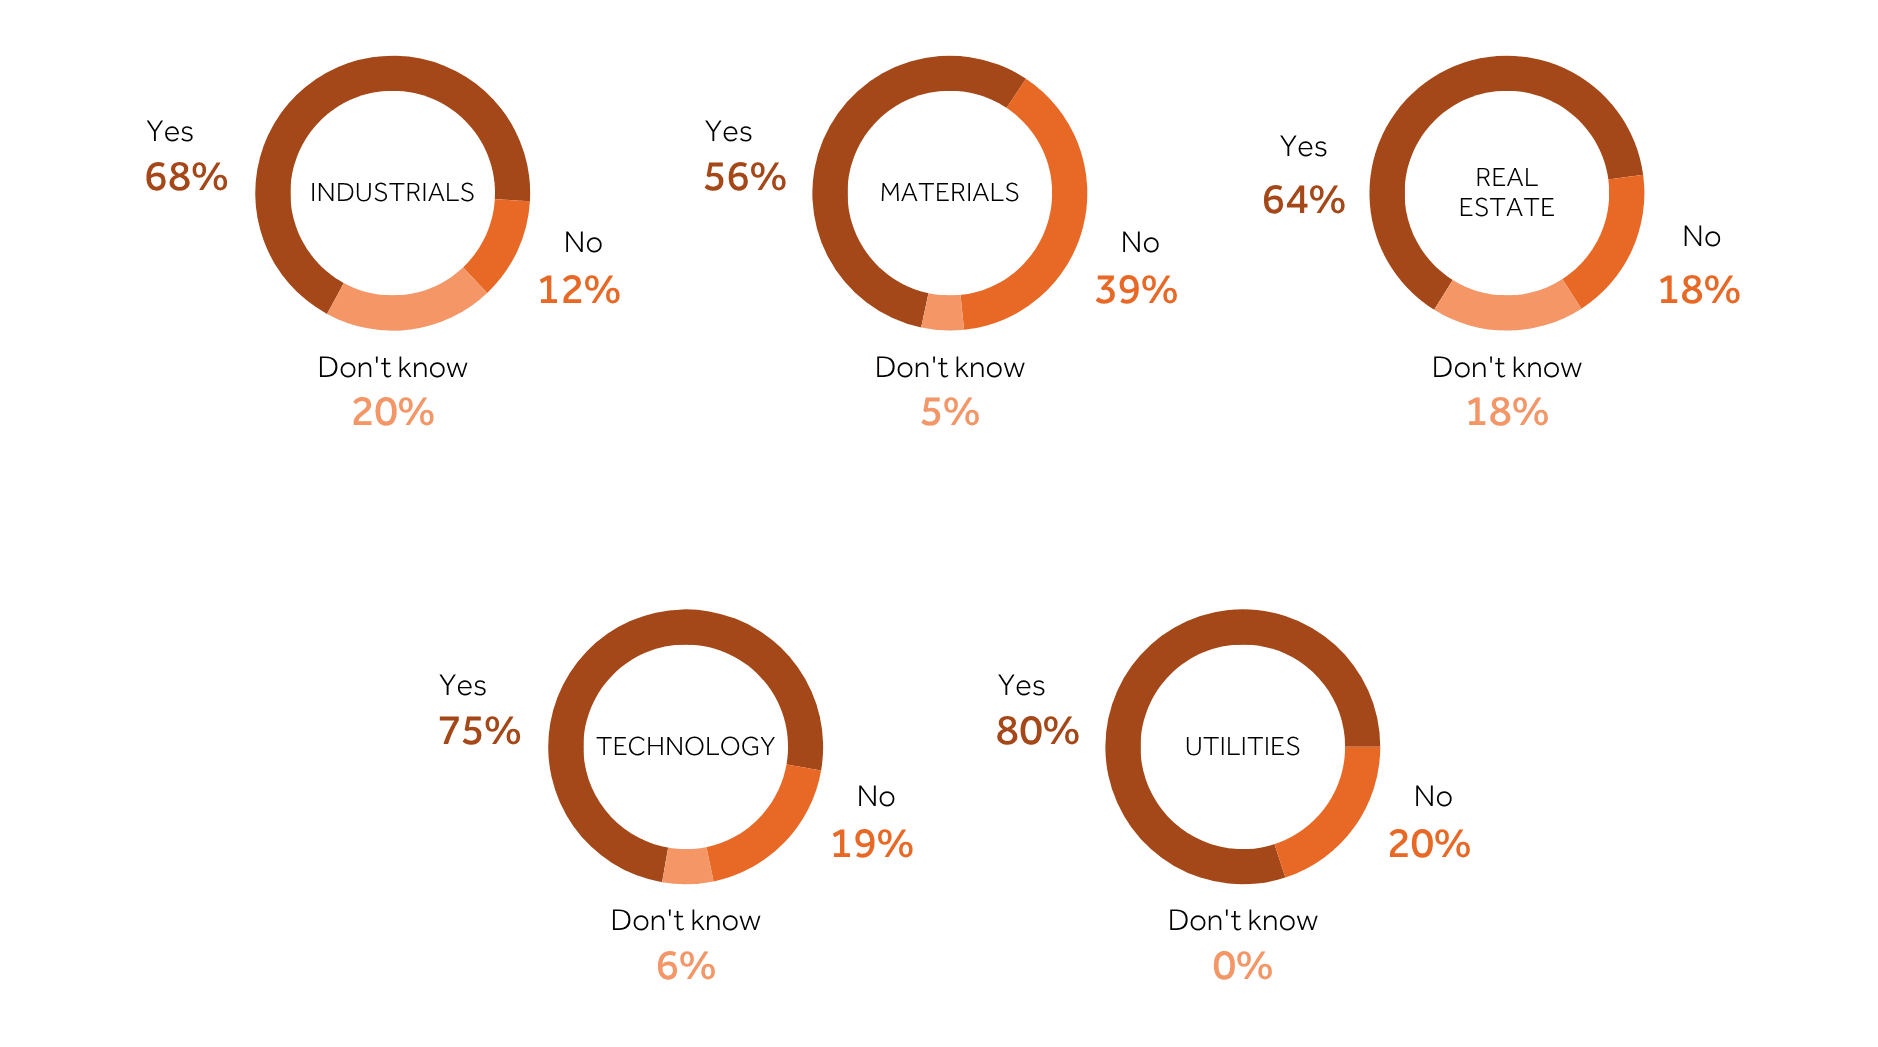
The global trend remains largely consistent when split by sector, bar the materials industry, where 39 percent of respondents would not partner with a sell-side firm that had a negative rating on their company.
For those on the sell side, it is clear that a negative rating can and does affect the relationship with IR, though most say this happens less often today.
With Visible Alpha, you can easily audit a given line-item to see the dispersion of estimates among different analysts to pick out the lows or more negative ratings, allowing you to spot any disconnects.
For example, if one analyst says that a tech company’s revenue will decline 12 percent but also forecasted cloud revenues to jump 80 percent due to a demand for AI capabilities, a savvy IRO can step in to point out the discrepancy.
For REITs, staying on top of consensus changes can be particularly complicated given that models are updated at unconventional times. One mid-sized REIT followed the traditional approach of waiting for an analyst report to come out and then requesting the model from the analyst to identify any updates. This was both time-consuming and meant that many of the revisions weren’t even spotted by the IR team. The company started to use Visible Alpha, which allowed it to see revisions being made to models in real-time, before any research note had been published. This allowed them to track all revisions, identify key trends early and communicate effectively with management about any shifts in market views.
Over time, one medical equipment company had compiled a huge spreadsheet with dozens of tabs covering different analyst models to manage earnings estimates internally. While effective to a certain extent, the spreadsheet required a significant time investment to maintain. Visible Alpha worked with the company in several ways. First, they automated the data inputs to the spreadsheet, taking away a large part of the manual labor associated with tracking consensus. Next, they simplified the structure of the spreadsheet, making it easier to read while retaining the same formatting that the company was familiar with. The new set up allowed the IR team to surface insights more quickly and accurately, while working within a familiar system and maintaining a close view of individual analyst models.
The use cases need not end there, however. Consider the following scenarios where IR can drive responses to shape market perception, influence internal strategy and respond to shocks with agility:
Geopolitical risk response: When new US tariffs are announced on Chinese goods, an IRO at a Chinese electronics firm can use consensus model revisions to anticipate where analysts expect the shortfall in US sales to hit.
From there, they can brief the executive team on which regions show potential for offsetting that demand – perhaps analysts are starting to model increased APAC or EMEA sales. That insight can support pivot strategies in sales, messaging or resource allocation.
Vendor displacement opportunity:If a US cellphone maker faces increased import costs due to trade restrictions on Chinese semiconductors, Japanese or Korean chipmakers could use Visible Alpha’s peer benchmarking tools to identify where it is exposed and proactively position themselves as a replacement vendor. This makes IR a strategic enabler of business development and partnership-building.
Guidance confidence check: Suppose management is preparing guidance on a new product rollout. If analyst expectations are misaligned with internal assumptions – especially on adoption rates or margins – IR can use the data to flag the misalignment early, clarify messaging and course-correct before earnings.
Whether due to geopolitics, trade tensions or other quick-breaking news items, companies can find themselves facing a crisis with little notice. Here’s a quick checklist for IROs to have handy in time for the next chaotic market event:
Monitor real-time market sentiment and set alerts for any anomalies
Check for estimate revisions across your top three KPIs
Benchmark your sector peers for directional change
Scan analyst commentary for themes or sentiment shifts
Package insights into a three-bullet briefing for the C-suite
Consider a proactive investor touchpoint if sentiment is diverging
Tailor your ongoing messaging with data-driven insights
Use what you’ve learned to enhance your predictive scenario planning.
With data sources proliferating and new tools coming to market, it’s clear that IR teams will become more and more data focused. But simply being able to reflect that data is not enough: information is only as powerful as the stories you can tell with it.
IROs are not just passive receivers of insights who regurgitate it into the market: they are giving investors the information they need (hopefully before the investors know they need it), actively shaping executive decisions within their organizations and – for the best-in-class IROs – helping to divine business strategies.
In order to make the most of that opportunity, it’s vital that IROs consider which data and insights will give them the greatest edge when supporting their stakeholders and then feeding that into strategic discussions. IR teams will need an effective data strategy to ensure new datasets can be turned into actionable insights.
Part of that strategy should involve considering which datasets give you insights that you can’t find anywhere else. While market data can be pulled from many sources, only a fraction will have sufficient quality, timeliness, accuracy and depth to truly get to the heart of what IR teams need to know about market expectations – and to demonstrate their ongoing strategic value to their organizations.